Flow Chart
Definition
Simply said, flow chart is a block diagram, describing an algorithm. It displays the sequence of steps that you need to do to complete a given task.
As the definition says it describes an algorithm. It is the universal method to visualize any sequence of steps. Thus it is used in programming, engineering, economics etc.
Flow chart usage
Every good programmer should be able to use them. Why? Because they are very powerful and convenient. Once you have the complete algorithm on a chart it is just a matter of writing the code in the language you want. And as we already explained writing the code is just one of the steps in the software development process. In my opinion it is the easiest step.
Let’s look at one example to see why this is a really good practice. You are a project manager in a software company. You are working on a mobile project. The customer gave you the task : Create an application for three different systems. This means – one algorithm, written in three different languages (or platforms).
First, you create a flow chart. It describes the whole functionality of the application, step by step. Then you give the same exact plan to each team, no matter for which platform they are writing. As long as each team follows the scheme each application will do pretty much the same thing – and that is what the customer wants.
If you don’t prepare the exact algorithm and you give only a text description of the task..
- Each team will do the task in its own way.
- You will have three similar applications, but not quite the same.
- This way it is more likely to have bugs and they will be harder to fix.
Another advantage when using a predefined algorithm is that it is easier to calculate the complexity of the algorithms. This way you can choose the best solutions for your task.
Now, did I make a big advertisement of flow charts?
Examples
Here are two very simple examples:
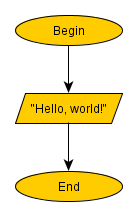
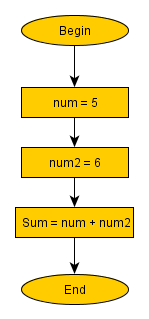
Looking at the examples above you could ask “Do I really need to create a plan for such easy tasks? In practice – no, but when learning – yes. First of all, in practice as a programmer you will not solve such easy tasks. These examples will be just a very small fraction of the program. Then why do them? Because “you have to learn to walk, before you can start running”.
Making all the examples by hand gives you the experience and confidence. You need them for the complex problems. Consider the next example:
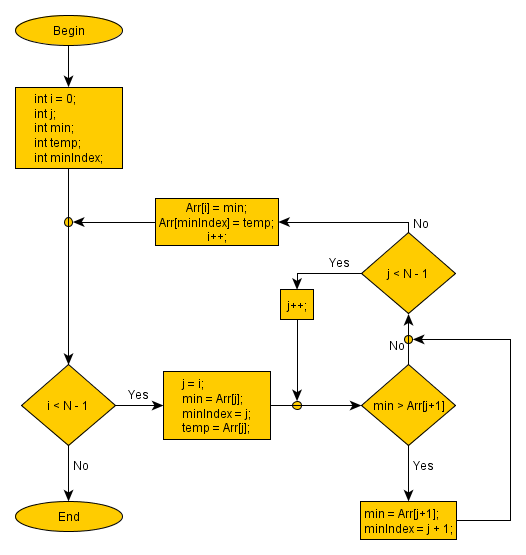
This is an example of sorting an array of integers. We use the selection sort method. Don’t worry if you don’t understand many things right now. Step by step you will learn how to construct such charts.
Separation
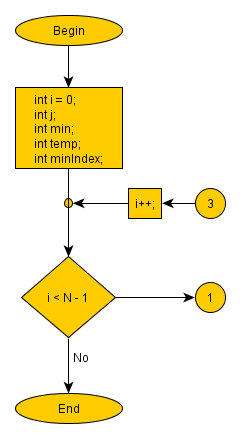
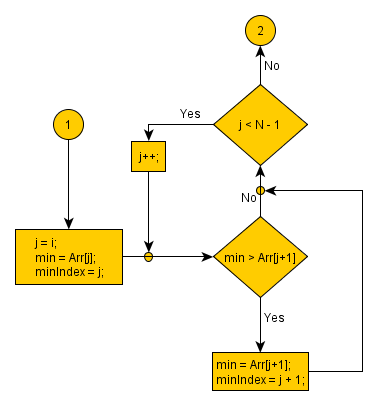

This is again the selection sort, but separated in three parts. You can use this technique when you create an algorithm on paper and run out of space. Also, when solving a complex
problem it is a good idea to separate it on simpler parts. In this case we take the complex
task “sort an array” and turn it into the following simple steps:
- Outer loop – the number of times we need to iterate through the array.
- Inner loop – iterating through the unsorted part of the array and find the minimal element.
- Put the element in its place.
Once again, if you do not understand everything – take it easy, just remember the basic idea – we can separate a flow chart in several parts. This is very useful when we solve a complex problem.
|
Previous: Software development process |
Next: Flow Chart Symbols |
Tutorial Contents:
1)Learn
Computer Programming
2)Software Development Process
3)Flow
Chart
4)Flow
Chart Symbols
5)Data
Type
6)What is a variable
7)Math
Operators
8)Logical
Operators
9)Loops
10)Nested Loops
11)Arrays
12)Multidimensional arrays
13)Programming Questions
 Manage the football team of your city and make them champions!
 Manage the football team of your city and make them champions!
 Manage the football team of your city and make them champions!